
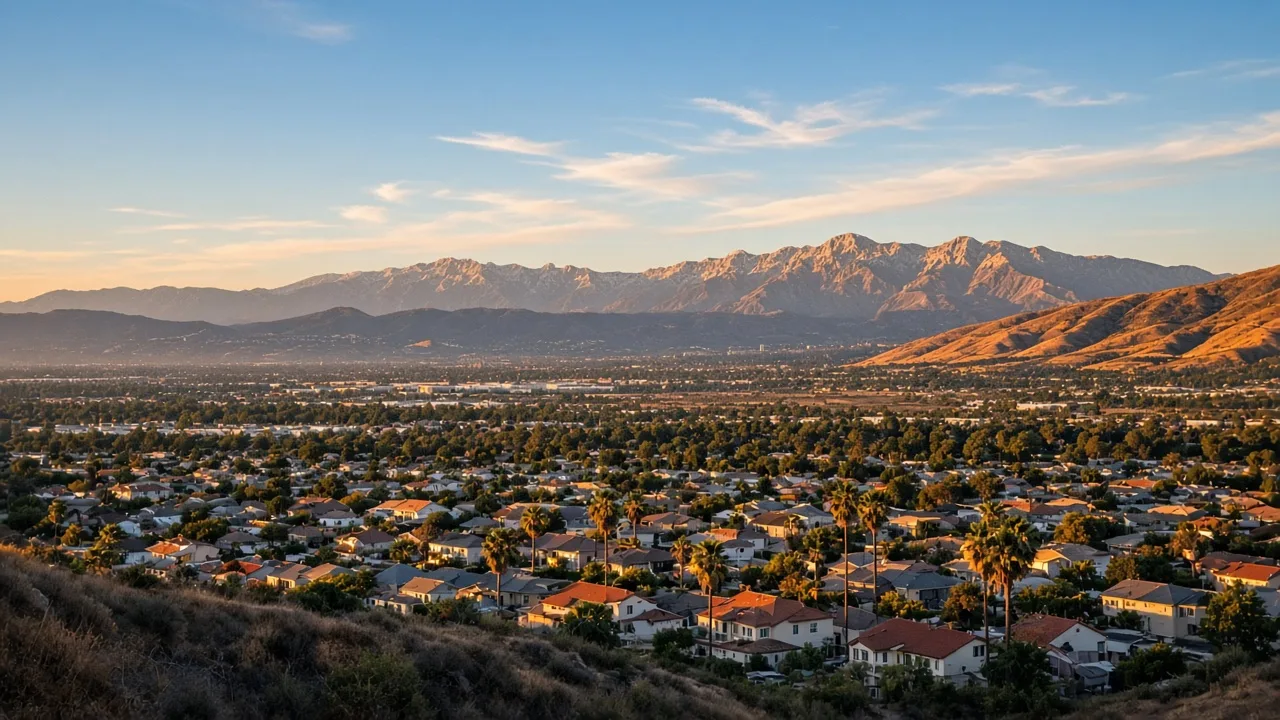
What does the latest Inland Empire housing data show?
The short answer is that the Inland Empire market is stable but slower than a year ago. Median prices for existing single-family homes were up about 1.7 percent year over year in September 2026, while closed sales fell roughly 10 percent from September 2025, and supply sat near five months. That combination, stable prices with lighter volume, describes a market settling into balance rather than a market in decline.
Everything below comes from public reports published this fall. The two primary sources are the California Association of Realtors (C.A.R.) September 2026 home sales and price report, released October 19, 2026, and the Homes.com Inland Empire housing market report covering August 2026, the most recent full month each had published when this was written. Sources and reporting periods are cited inline so you can check every number yourself.
What are median home prices doing in the Inland Empire?
C.A.R.'s September 2026 report put the median price of an existing single-family detached home in the Riverside/San Bernardino region at $601,030. That is up 0.2 percent from August 2026 and up 1.7 percent year over year from $591,010 in September 2025, per the C.A.R. September 2026 home sales and price report. By comparison, the statewide California median was $899,720 in the same report.
The Homes.com Inland Empire housing market report for August 2026 put the two-county median sale price at $580,000, essentially flat year over year. The gap between the two medians is methodology, not disagreement: C.A.R. tracks existing single-family detached homes, while the Homes.com figure blends all property and sale types. Both readings point the same direction: prices holding steady in a range, with no broad crash and no boom.
How much inventory is on the market?
Homes.com counted 15,531 active listings in the Inland Empire in August 2026, down about 7.9 percent from a year earlier, with 4.5 months of supply. C.A.R.-based analyses put the region's September supply near 4.5 to 4.7 months, per North Coast Financial's September 2026 California market analysis, which compiles C.A.R.'s regional data.
Months of supply measures how long the current list of homes would take to sell at the current pace. As a rough rule of thumb, about three months or less leans toward sellers, six months or more leans toward buyers, and the band in between is balanced. At 4.5 to 5 months, the Inland Empire sits in the balanced zone, slightly tighter than a true buyer's market.
One important context: inventory is actually down year over year, so the cooling you feel is in demand and days on market, not a glut of listings. Our answer to is the Inland Empire market cooling or heating up explains why that gap matters.
How fast are homes selling, and for how close to asking?
The August 2026 Homes.com report shows a median of 59 days on market for the Inland Empire, homes selling at 97 percent of their final list price, and 3,330 closed sales during the month. C.A.R.-based numbers put September median days on market around 41 for the region, and C.A.R.'s report shows regional sales down 2.9 percent from August and down 10.2 percent year over year.
Two signals stand out. First, sales volume is meaningfully lower than a year ago, and that is the clearest cooling sign in the data. Second, the 97 percent list-to-sale ratio says well-priced homes still draw offers essentially at asking, so deep discounts are not the norm. In plain terms, houses are taking longer to sell, but when they do sell, they sell close to their price.
Days on market is one of the first metrics Julian checks in a ZIP-level market report, and the how long are homes staying on the market Q&A covers why the trend matters more than any single number.
Is it a buyer's market or a seller's market right now?
With supply near 4.5 to 5 months and prices flat to up slightly, the honest label is a balanced market with a mild seller tilt on price and a mild buyer tilt on time. Sellers who price against current comparable sales can still expect offers near asking. Sellers who price above the data absorb the slowdown: the home sits, and the price gets cut later.
Buyers have more leverage on time than on price. There is more to tour than there was two years ago, and sellers are more willing to negotiate on repairs, closing costs, and move dates. The buyer's market or seller's market Q&A lays out how to read the balance for a specific area.
What do these numbers mean for buyers?
Buying conditions are better than they were, but they are not dramatically cheaper. Prices are not falling broadly, and homes in sought-after neighborhoods still sell near asking within a few weeks. The practical edge for buyers right now is time: more inventory and longer days on market mean less pressure to waive contingencies and more room to negotiate.
If you are looking, get pre-approved before you start touring so you can move when the right home appears, and use the extra inventory to be selective instead of rushed. The Inland Empire home buying guide maps every step from offer to close for San Bernardino and Riverside counties.
What do these numbers mean for sellers?
For sellers, the 2026 market rewards honest pricing. Homes priced at or just below current comparables sell in line with that 97 percent list-to-sale ratio. Overpriced homes absorb the market's slower pace and often end up selling for less after a price cut than they would have at the right number from day one.
Start with a free home value estimate before you choose a strategy, then compare the routes: a traditional listing maximizes exposure, while a vetted cash offer or hybrid path trades some proceeds for speed and certainty. For sellers who want a structured preparation sprint, Julian's Smart Seller Method is one option among several, subject to eligibility and written terms, with no particular result, price, or timeline guaranteed.
Where is the Inland Empire market headed from here?
The honest answer is that nobody can promise a direction, and anyone who does is guessing. What the data through fall 2026 shows is a slower, more balanced, price-stable market rather than a sharp correction, with mortgage rates the biggest swing factor for both demand and prices.
The signals worth watching are the same ones in this snapshot: sales volume compared with a year ago, months of supply, and list-to-sale ratios. When you know your ZIP's numbers, questions like are home prices dropping in Southern California stop being headline-driven. A market report for your area is the fastest way to get them.
Frequently asked questions about the Inland Empire market
Are home prices dropping in the Inland Empire? Not broadly as of the September 2026 data. C.A.R.'s regional median was $601,030, up 1.7 percent year over year, and Homes.com's August median was $580,000, flat year over year. Individual ZIPs and price segments differ, which is why local data beats headlines.
How long are homes staying on the market? The August 2026 Homes.com report put the regional median at 59 days, and C.A.R.-based analyses put September around 41 days. Both are higher than the fast markets of 2021 and 2022, which is the clearest sign of a cooler, more balanced market.
Is now a good time to buy in the Inland Empire? That depends on your timeline, budget, and target area rather than on a single headline number. Balanced supply means less bidding pressure and more room to negotiate, and the new construction buyer page or first-time buyer page helps with the planning side.
Is now a good time to sell? For a well-priced home in a strong neighborhood, yes: list-to-sale ratios near 97 percent mean offers come close to asking. Expect a longer timeline than in 2022, and price the home against current comparables, not last year's.
How do I get a market report for my ZIP code? Julian Cesar prepares free, ZIP-level reports through the market reports page or the contact form. Include your area and the decision you are weighing, and the report is built around that question.
The bottom line for your corner of the market
Regional medians point in one direction, but your ZIP, price range, and home type can move differently. That is why the real work is local: comparable-sale pricing, days on market in your area, and an honest read of whether you are buying, selling, or holding.
If you want the numbers for your specific area, the fastest path is a free, no-pressure conversation. Book a Smart Call through the schedule page, call 951-456-4209, or email info@searchsocal.com. Julian Cesar, AI-Certified Agent, Search SoCal Real Estate, Compass. Agent license CA DRE #02015349; broker: Compass, CA DRE #01527365.
This snapshot summarizes published market reports for general information only, not legal, tax, or investment advice. Verify current figures with your lender, a local agent, or the original sources before acting, and consult a qualified professional for advice specific to your situation.